What you'll find in this article
The Shift from Reporting to Intelligence
For most organisations, business intelligence has very much been a well-known-but-disappointing cycle. Analysts waste about 80 % of their time dealing with cleaning data, making it ready, creating models and formatting visuals. That means there is about 20 % of their time for actual analysis and insight generation. The outcome: delayed turnaround, congested dashboards, and decision-makers still feeling like they’re holding out for the next report.
What if the BI workflow could be significantly smoother? Not only quicker, but also more intelligent. With Power BI’s integrated AI visuals and its more recent generative AI sidekick — Copilot, the platform is making a change: from merely being a tool for visualisation to becoming a partner in intelligence. One that you query questions to, instead of one that you force charts upon.
In this blog, we examine how the combination of Power BI’s core AI features along with the new generative Copilot capabilities are driving time-to-insight, enabling business users, and revolutionizing the data analyst role.
The Foundation of AI in Power BI and the Road to Copilot (Pre-Copilot)
Before Copilot entered the scene, Power BI already introduced smart features that automate parts of the analytics workflow. These form the foundation on which the generative leap is built.

A. Automated Insight Visuals
Consider the Key Influencers visual. Rather than having to drill down manually through dozens of dimensions, this visual automatically reveals the drivers of a chosen metric. If, for instance, customer satisfaction is declining, Power BI could determine that shipping time or first-contact resolution rate are the key-influencers.
Another useful one is the Decomposition Tree chart. As revenue falls, say, this chart allows you to automatically slice by product, region, salesperson — and immediately bring to the top where it’s falling from. These charts cut down on manual exploration and enable you to speed up root-cause analysis.
B. Automated Machine Learning (AutoML)
Not all organisations have full-time data scientists. So Power BI’s AutoML offerings bring predictive modelling within reach of business analysts: churn prediction, sales forecasting, even simple classification or regression tasks without needing to code. This opens up more strategic insight possibilities earlier in the workflow.
C. Smart Narratives
Visual dashboards can be effective, but business users still tend to ask, “What does it all mean?” Smart Narratives solve that by creating plain-English explanations of what visuals reveal: “During Q2, product X sales fell 15% from Q1, primarily as a result of Region Y.” It fills the gap between charts and insight, making the data’s underlying story clearer.
Cumulatively, these fundamental properties stage the groundwork: they automate discovery, lower effort and create preparedness for the next giant stride toward generative AI.
Copilot and the Generative Shift in Power BI
Now we arrive at the game-changer: the generative AI revolution brought into Power BI via Copilot. This is where workflows change- not just being faster but different in kind.
A. Conversational Report Creation
Envision this: you enter “Create a sales report for the Northeast region with year-to-date variance by product category” and receive a fully formatted report page—visuals, filters, layout—in minutes. That is the vision of the Report Copilot experience, which we released to the Power BI service (and soon to Desktop).
This cuts the time on drag-and-drop, formatting and revision by far. Rather than having to construct the first draft manually, you are provided with a smart starting point and then iterate from there.
B. DAX and Measure Generation
One of the biggest obstacles for most analysts has been the high learning curve of DAX (Data Analysis Expressions). Now that Copilot can produce DAX queries based on natural-language input, that obstacle becomes much smaller. For instance: “Write a measure for Month-over-Month Sales Change,” and Copilot writes the DAX, describes it and you can tweak it. Microsoft’s October 2025 release makes this feature more widely available.
This frees up fewer analysts stuck waiting for the DAX guru, and more users able to analyse for themselves. It makes calculation-sophistication democracy for the team.
C. Data Model Summarisation and Q&A Enhancement
It can be a big onboarding barrier to understand a semantic model—its tables, relationships, measures. Copilot now summarises your model for you: describing what each table is, how measures are defined, referencing hierarchies and relationships.
Simultaneously, the “Chat with your data” experience enables business users to pose natural-language queries and receive visuals along with narratives from true report content, rather than model metadata. For instance: “What product category drove Q3 sales?” and Copilot responds with a chart along with commentary.
These features enhance self-service analytics and minimize friction between business users and the BI team.
The Strategic Impact on Analytics Workflows
These new features do not only change features—they reshape how analytics workflows operate and how organisations structure their teams.
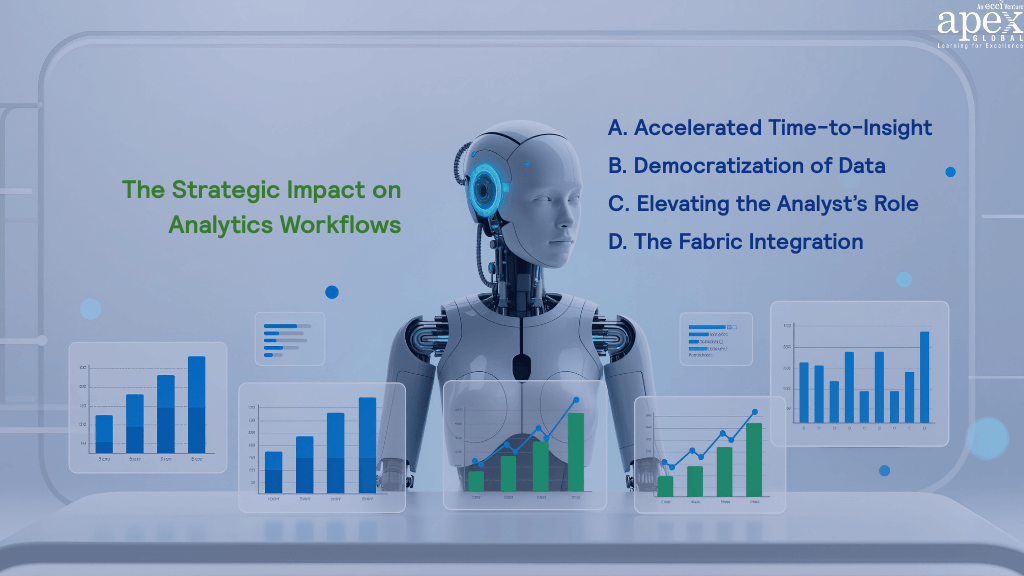
A. Accelerated Time-to-Insight
Perhaps the most tangible benefit is speed. What might once have taken days—data prep, modelling, visualisation, narrative—can now often be done in hours or even minutes. The question “What is driving the drop in Region East sales?” might be answered instantly by Copilot generating a report, calculating measures, and summarising insights. This shorter time-to-insight means business decisions can be made faster and more responsively.
B. Democratization of Data
Traditionally, business users waited in the queue for the BI team to supply dashboards. With conversational prompts and AI-assisted report creation, sales managers, HR leads or marketers can now explore data themselves. They might ask Copilot a question or build a simple report without heavy dependence on IT. This shifts the bottleneck and expands the circle of analytics empowerment.
C. Elevating the Analyst’s Role
As automation handles the repetitive tasks—data cleaning, basic visuals, standard calculations—analysts free up to focus on higher-value work: model governance, validation of AI outputs, strategy, and stakeholder consulting. They become the expert interpreters and guides. Instead of building every chart, their role shifts toward oversight, quality control and strategic insight.
D. The Fabric Integration
It’s important to note that Copilot and Power BI are not operating in isolation. They are part of the broader Microsoft Fabric ecosystem (including lakehouse, data engineering, governance). As such, analytics workflows sit in a unified architecture where data preparation, modelling, analytics and insights live together.
This integration enables better governance, repeatability and scalability of analytics across the enterprise.
Conclusion: From Dashboards to Dialogue

Two powerful forces are redefining how analytics happens in Power BI today, its built-in AI capabilities and the new generative Copilot experience. Together, they have turned the platform from a manual reporting tool into a truly intelligent, self-service environment where insights come faster and decisions feel more intuitive.
If you already work with Power BI, whether as an analyst, business user, or BI manager, this is the perfect moment to explore what’s possible. Begin with the AI-driven visuals like Key Influencers, Decomposition Tree, and Smart Narratives to see how easily the platform surfaces patterns and explanations you might have missed before. Then get your semantic models ready for Copilot by ensuring that your tables, columns, and measures are clearly named and well documented. A clean model helps the AI understand context and deliver more accurate results.
Next, experiment with Copilot itself. Use natural language prompts to draft a new report, generate a DAX measure, or ask questions about your data and watch how quickly those actions translate into meaningful visuals. The shift is immediate, with less time spent arranging visuals and more time spent interpreting what they reveal.Analytics is moving from clicks to conversation. The tools are no longer just displaying information; they’re beginning to think alongside you. By embracing this evolution now, you set yourself and your organisation up for a future where insight is instant, collaboration is simpler, and strategic value comes naturally. To further enhance your skills, consider exploring the MS Power BI and Advanced MS Power BI courses, designed to provide in-depth knowledge and hands-on experience with these transformative tools.